728x90
반응형
화요일[하루가 어떻게 지나갔는지 모르겠다.]
1. 만든 코드 기재
2. wishlist 기재
1. 금일 만든 코드
import requests
from bs4 import BeautifulSoup
import numpy as np
import pandas as pd
import matplotlib.pyplot as plt
import json
import re
import pandas as pd                # 데이터를 저장하고 처리하는 패키지
import matplotlib as mpl           # 그래프를 그리는 패키지
import matplotlib.pyplot as plt    # 그래프를 그리는 패키지
import csv
import matplotlib.dates as mdates
import os

df =  pd.read_csv('data/seoulreal.csv',encoding='utf-8')
d_ = df.sort_values(by='redate', ascending=False, ignore_index=True) #정렬
df.drop(columns=['lostSEQ','state','dateofreceipt','details','place','ID','name','region','company','thing','views','ext'], inplace=True) #사용하지 않는 값 삭제
#isno = None만 찾아주는 것
pd.isna(df)
df = df.dropna() #결측치 제거
In [208]:
df['date'] = pd.to_datetime(df['redate'].str.strip(), format='%Y-%m-%d', errors='raise') #int를 str로 change
# 'redate' = 날짜
# 'kinds' = 물품
# df_new.reset_index(inpddlace=True) #인덱스 수 reset_index
df.set_index(df['date'], inplace=True) #데이트 칼럼을 인덱스로 지정
# weekly_df = df.resample('W-Mon', how={'kinds':np.sum}).fillna(0) #월요일 설정
print(type(df['date']))
day = [g for n, g in df.set_index('date').groupby(pd.Grouper(freq='D'))]#일마다 지정
week = [g for n, g in df.set_index('date').groupby(pd.Grouper(freq='W'))]#주마다 지정
month = [g for n, g in df.set_index('date').groupby(pd.Grouper(freq='M'))]#월마다 지정
month_list = []
for i in month :
# print(i.index)
month_list.append(i.index)
# print(type(i))
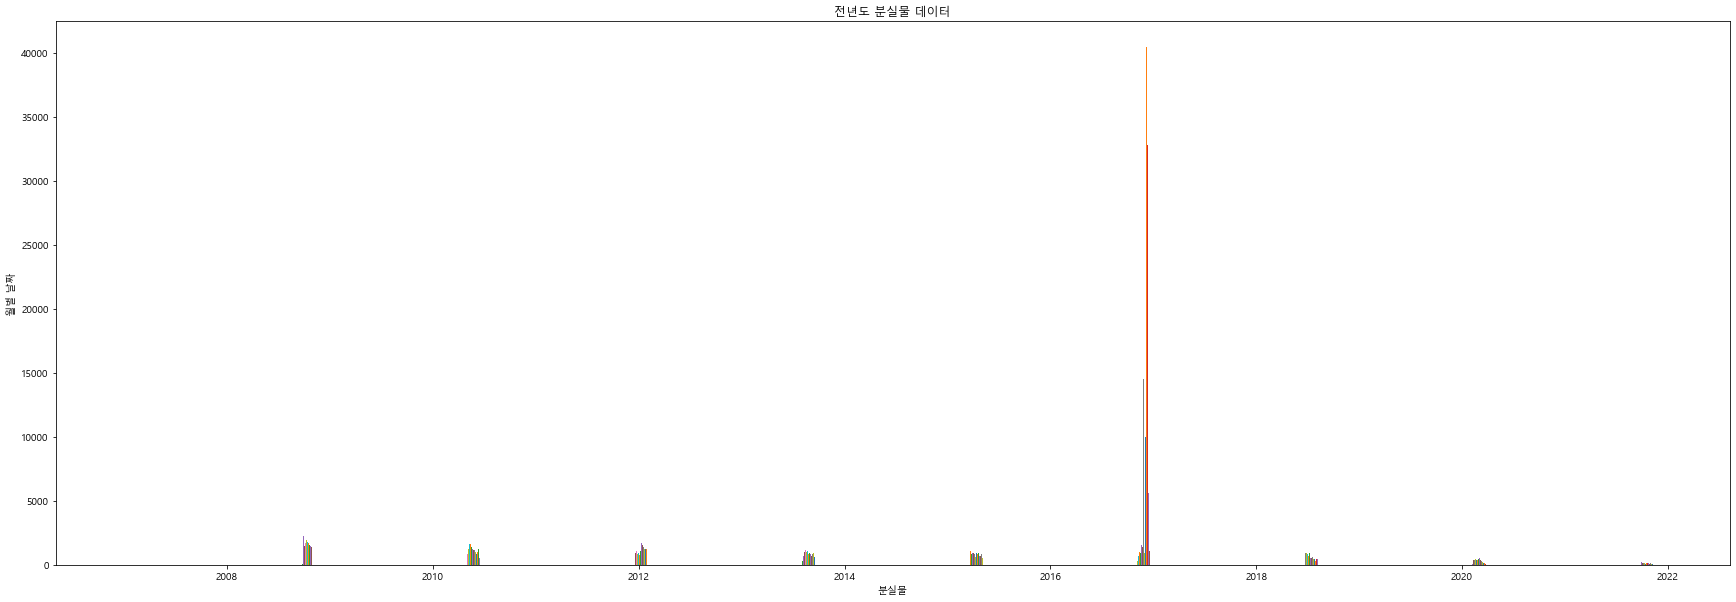
plt.figure(figsize=(30,10))
plt.rc('font',family='Malgun Gothic') #맑은 고딕font set
plt.hist(month_list)
plt.title('전년도 분실물 데이터')
plt.xlabel('분실물')
plt.ylabel('월별 날짜')
# plt.ylim((1000,2000))
plt.show()
<class 'pandas.core.series.Series'>
In [403]:
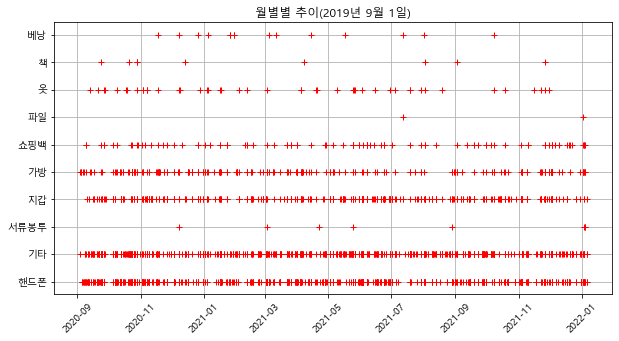
plt.figure(figsize=(10,5))
d_ = df[df["redate"] > "2020-09-02"]
plt.rc('font',family='Malgun Gothic')
plt.title("월별별 추이(2019년 9월 1일)")
plt.xticks(rotation=45)
plt.grid()
plt.plot(d_['date'], d_['kinds'], 'r+')
plt.show()


# spot_ = 184
plt.figure(figsize=(40,10))
plt.title("일별 추이(2019년 9월 1일)", fontsize=15)
ax = plt.subplot(1,1,1)
plt.xticks(rotation=45)
ax.plot(d_["redate"],d_["kinds"], "rs", label=str)
ax.xaxis.set_major_formatter(mdates.DateFormatter('%Y-%m-%d'))
plt.legend(fontsize=13)
plt.grid()
plt.show()

#ba
# redate등록일자 dateofreceipt분실일자 kinds 종류
# seoul_df = df.loc[[]]
# seoul_df

In [196]:
df['month_date'] = pd.to_datetime(df['redate']).dt.strftime('%Y-%m')
df
Out[196]:
redatekindsdatemonth_datedate2022-01-062022-01-062022-01-042022-01-042022-01-06...2016-09-212009-04-222009-02-072009-02-052006-12-04
| 2022-01-06 | 핸드폰 | 2022-01-06 | 2022-01 |
| 2022-01-06 | 기타 | 2022-01-06 | 2022-01 |
| 2022-01-04 | 핸드폰 | 2022-01-04 | 2022-01 |
| 2022-01-04 | 서류봉투 | 2022-01-04 | 2022-01 |
| 2022-01-06 | 기타 | 2022-01-06 | 2022-01 |
| ... | ... | ... | ... |
| 2016-09-21 | 기타 | 2016-09-21 | 2016-09 |
| 2009-04-22 | 핸드폰 | 2009-04-22 | 2009-04 |
| 2009-02-07 | 핸드폰 | 2009-02-07 | 2009-02 |
| 2009-02-05 | 기타 | 2009-02-05 | 2009-02 |
| 2006-12-04 | 지갑 | 2006-12-04 | 2006-12 |
274950 rows × 4 columns
In [206]:
# plt.figure(figsize=(10,10))
# plt.bar(df[df['month_date'] < "2021-12-30"] , df['kinds'])
In [405]:
df_new = df.groupby(['month_date','kinds'], as_index=False).count()
df_day = df.groupby(['redate','kinds'], as_index=False).count()
df_day
Out[405]:
redatekindsdatemonth_date01234...2355223553235542355523556
| 2006-12-04 | 지갑 | 1 | 1 |
| 2007-11-07 | 핸드폰 | 1 | 1 |
| 2007-11-12 | 기타 | 1 | 1 |
| 2007-11-15 | 핸드폰 | 1 | 1 |
| 2007-11-22 | 가방 | 1 | 1 |
| ... | ... | ... | ... |
| 2022-01-04 | 쇼핑백 | 1 | 1 |
| 2022-01-04 | 핸드폰 | 2 | 2 |
| 2022-01-06 | 기타 | 2 | 2 |
| 2022-01-06 | 지갑 | 1 | 1 |
| 2022-01-06 | 핸드폰 | 2 | 2 |
23557 rows × 4 columns
In [309]:
d21_ = df_new[df_new["month_date"].between("2021-01","2021-12")]
d20_ = df_new[df_new["month_date"].between("2020-01","2020-12")]
d19_ = df_new[df_new["month_date"].between("2019-01","2019-12")]
d18_ = df_new[df_new["month_date"].between("2018-01","2018-12")]
d17_ = df_new[df_new["month_date"].between("2017-01","2017-12")]
d16_ = df_new[df_new["month_date"].between("2016-01","2016-12")]
d15_ = df_new[df_new["month_date"].between("2015-01","2015-12")]
d14_ = df_new[df_new["month_date"].between("2014-01","2014-12")]
d13_ = df_new[df_new["month_date"].between("2013-01","2013-12")]
d12_ = df_new[df_new["month_date"].between("2012-01","2012-12")]
d11_ = df_new[df_new["month_date"].between("2011-01","2011-12")]
d10_ = df_new[df_new["month_date"].between("2010-01","2010-12")]
d09_ = df_new[df_new["month_date"].between("2009-01","2009-12")]
d08_ = df_new[df_new["month_date"].between("2008-01","2008-12")]
d07_ = df_new[df_new["month_date"].between("2007-01","2007-12")]
d06_ = df_new[df_new["month_date"].between("2006-01","2006-12")]
In [357]:
# Plot bar chart
#2021년도
plt.figure(figsize=(20,15))
plt.subplot(4, 4, 1)
plt.bar(d21_['kinds'], d21_['date'], color ='r', width = 0.25)
plt.title("2021년도 분실물 현황")
#2020년도
plt.subplot(4, 4, 2)
plt.bar(d20_['kinds'], d20_['date'], color ='r', width = 0.25)
plt.title("2020년도 분실물 현황")
# 2019년도
plt.subplot(4, 4, 3)
plt.bar(d19_['kinds'], d19_['date'], color ='r', width = 0.25)
plt.title("2019년도 분실물 현황")
# 2018년도
plt.subplot(4, 4, 4)
plt.bar(d18_['kinds'], d18_['date'], color ='r', width = 0.25)
plt.title("2018년도 분실물 현황")
# 2017년도
plt.subplot(4, 4, 5)
plt.bar(d17_['kinds'], d17_['date'], color ='r', width = 0.25)
plt.title("2017년도 분실물 현황")
# 2016년도
plt.subplot(4, 4, 6)
plt.bar(d16_['kinds'], d16_['date'], color ='r', width = 0.25)
plt.title("2016년도 분실물 현황")
# 2015년도
plt.subplot(4, 4, 7)
plt.bar(d15_['kinds'], d15_['date'], color ='r', width = 0.25)
plt.title("2015년도 분실물 현황")
# 2014년도
plt.subplot(4, 4, 8)
plt.bar(d14_['kinds'], d14_['date'], color ='r', width = 0.25)
plt.title("2014년도 분실물 현황")
# 2013년도
plt.subplot(4, 4, 9)
plt.bar(d13_['kinds'], d13_['date'], color ='r', width = 0.25)
plt.title("2013년도 분실물 현황")
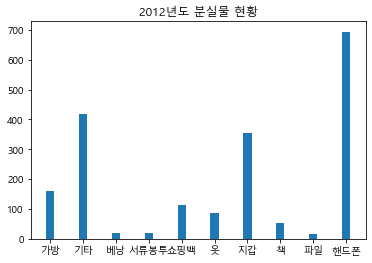
# 2012년도
plt.subplot(4, 4, 10)
plt.bar(d12_['kinds'], d12_['date'], color ='r', width = 0.25)
plt.title("2012년도 분실물 현황")
# 2011년도
plt.subplot(4, 4, 11)
plt.bar(d11_['kinds'], d11_['date'], color ='r', width = 0.25)
plt.title("2011년도 분실물 현황")
# 2010년도
plt.subplot(4, 4, 12)
plt.bar(d10_['kinds'], d10_['date'], color ='r', width = 0.25)
plt.title("2010년도 분실물 현황")
# 2009년도
plt.subplot(4, 4, 13)
plt.bar(d09_['kinds'], d09_['date'], color ='r', width = 0.25)
plt.title("2009년도 분실물 현황")
# 2008년도
plt.subplot(4, 4, 14)
plt.bar(d08_['kinds'], d08_['date'], color ='r', width = 0.25)
plt.title("2008년도 분실물 현황")
# 2007년도
plt.subplot(4, 4, 15)
plt.bar(d07_['kinds'], d07_['date'], color ='r', width = 0.25)
plt.title("2007년도 분실물 현황")
# 2006년도
plt.subplot(4, 4, 16)
plt.bar(d06_['kinds'], d06_['date'], color ='r', width = 0.25)
plt.title("2006년도 분실물 현황")
plt.show()

In [450]:
m1_ = df_day[df_day["redate"].between("2021-01-01","2021-01-31")]
m2_ = df_day[df_day["redate"].between("2021-02-01","2021-02-31")]
m3_ = df_day[df_day["redate"].between("2021-03-01","2021-03-31")]
m4_ = df_day[df_day["redate"].between("2021-04-01","2021-04-31")]
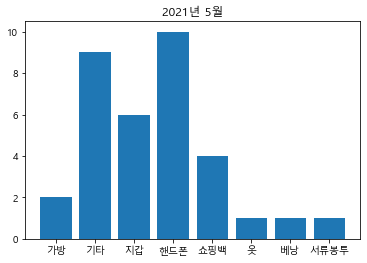
m5_ = df_day[df_day["redate"].between("2021-05-01","2021-05-31")]
m6_ = df_day[df_day["redate"].between("2021-06-01","2021-06-31")]
m7_ = df_day[df_day["redate"].between("2021-07-01","2021-07-31")]
m8_ = df_day[df_day["redate"].between("2021-08-01","2021-08-31")]
m9_ = df_day[df_day["redate"].between("2021-09-01","2021-09-31")]
m10_ = df_day[df_day["redate"].between("2021-10-01","2021-10-31")]
m11_ = df_day[df_day["redate"].between("2021-11-01","2021-11-31")]
m12_ = df_day[df_day["redate"].between("2021-12-01","2021-12-31")]
In [424]:
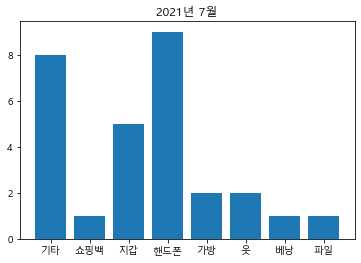
plt.title("2021년 7월")
# plt.pie(df_day['date'], labels = df_day['kinds'])

plt.bar(m7_['kinds'], m7_['date'])

plt.show()
In [456]:
a = int(input('분실물을 보고싶은 월을 기재하세요.'))


if a > 12 :
    print("1월부터 12월까지 중 숫자만 기입해주세요.")
elif a < 10 :
    month = '0' + str(a)
elif a > 10 :
     month = str(a)

start = '2021-'+str(month)+'-01'
end = '2021-'+str(month)+'-31'


df_g = df_day[df_day["redate"].between(start,end)]

plt.title("2021년 %d월"%a)
plt.bar(df_g['kinds'], df_g['date'])

plt.show()
In [467]:
b =int(input('2006-2021까지 분실물을 보고싶은 년도를 4자리를 기재하세요.'))
if b > 2021 :
    print('2021보다 큰 년도 수는 나타낼 수 없습니다.')
# elif b > 10 :
#     year = '0' + str(b)
elif b < 2006 :
    print('2006보다 작은 년도 수는 나타낼 수 없습니다.')


start = str(b) + "-01"
end = str(b) + "-12"

df_y = df_new[df_new['month_date'].between(start,end)]
plt.bar(df_y['kinds'], df_y['date'], width = 0.25)
plt.title('%d년도 분실물 현황'%b)
plt.show()
In [466]:
c =input('2006-2021중 보고싶은 년도의 월을 yyyymm 형식으로 기재하세요.')

start = str(c) + "-01"
end = str(b) + "-12"

df_y = df_new[df_new['month_date'].between(start,end)]
plt.bar(df_y['kinds'], df_y['date'], width = 0.25)
plt.title('%d년도 분실물 현황'%b)
plt.show()
Out[466]:
redatekindsdatemonth_datedate2022-01-062022-01-062022-01-042022-01-042022-01-06...2016-09-212009-04-222009-02-072009-02-052006-12-04
| 2022-01-06 | 핸드폰 | 2022-01-06 | 2022-01 |
| 2022-01-06 | 기타 | 2022-01-06 | 2022-01 |
| 2022-01-04 | 핸드폰 | 2022-01-04 | 2022-01 |
| 2022-01-04 | 서류봉투 | 2022-01-04 | 2022-01 |
| 2022-01-06 | 기타 | 2022-01-06 | 2022-01 |
| ... | ... | ... | ... |
| 2016-09-21 | 기타 | 2016-09-21 | 2016-09 |
| 2009-04-22 | 핸드폰 | 2009-04-22 | 2009-04 |
| 2009-02-07 | 핸드폰 | 2009-02-07 | 2009-02 |
| 2009-02-05 | 기타 | 2009-02-05 | 2009-02 |
| 2006-12-04 | 지갑 | 2006-12-04 | 2006-12 |
tomorrow wish list
.수업 잘 듣기
. 선생님이 마지막 날이니 선물 사기
728x90
반응형
'IT To do and To was' 카테고리의 다른 글
| 22년 1월 13일_java 첫 맞춤, 강사..ㅋㅎ... (0) | 2022.01.13 |
|---|---|
| 22년 1월 12일_python수업 마지막날, team project final, take a resting (0) | 2022.01.12 |
| 22년 1월 10일_데이터 프레임, pandas more the deep (0) | 2022.01.10 |
| 22년 1월 9일_team project work (0) | 2022.01.10 |
| 22년 1월 8일_개인 small project made, python그래프 (0) | 2022.01.09 |


